"A point of view can be a dangerous luxury when substituted for insight and understanding." -Marshall McLunhan
To give church leaders more insight and understanding, we are excited to announce the release of an Analytics Dashboard for Ekklesia 360!
This dashboard was birthed out of a trend we found while creating the Content Strategy and the Church White Paper.
While researching content strategy, we found that only 33% of churches measure how successful they are online. This stat shocked us because we know how helpful analytics can be for a church and what important ministry insights they can provide.
We started to ask, “Why don’t more churches use analytics?”
We heard from church communicators and pastors:
-
“Google analytics is too complicated. I don’t know where to start.”
-
“I’m so busy with all my other responsibilities. I don’t have time for analytics.”
-
“I look at analytics so sporadically. I have no clue how to use the information.”
With this in mind, we set out to create a dashboard that is easy to understand, shows a snapshot of what’s happening on a church website and is part of a church communicator's regular workflow.
If you’re a current client, you can see this now by logging in to your dashboard here. If not, and you’re interested in learning more about church website analytics, contact us here.
With the new Analytics Dashboard, our engineering team hopes that churches will learn how to display their web content to achieve better ministry results.
In order to decide which analytics to focus on, Kenny consulted with AJ Fenlason, our Strategic Services Manager, to determine what was most relevant for churches.
Top 5 Reports For Churches
1. Total Visits - How Many People Have Visited Your Site?
This chart shows the total number of people who visited your website this year compared to last year.
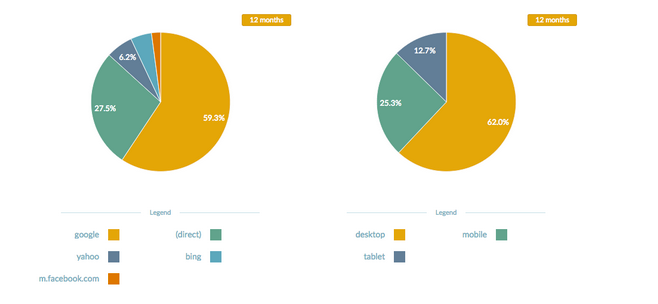
2. Visitor Sources - Where Did Your Visitors Come From?
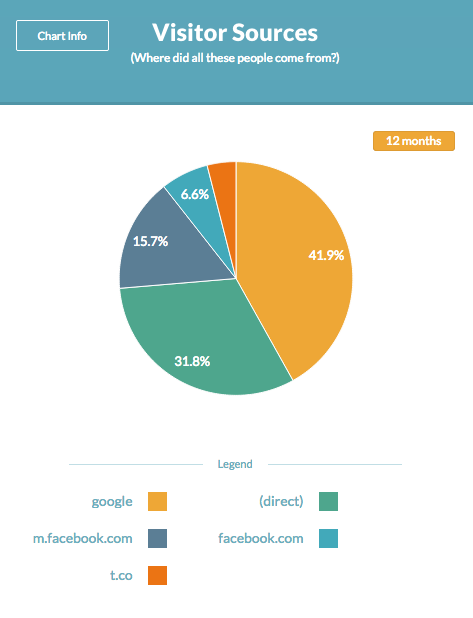
This chart shows the top places on the internet from where your visitors originated.
In this case, the dashboard measures visits from Google, Facebook, and Twitter as well as direct visits from people typing in your organization’s URL. If visitors came from other sites, the graph would depict that as well.
The visitors graph also takes into account mobile visits. Above, 15.7% of visitors came from mobile Facebook, or m.facebook.com.
3. Device Type - How Are People Viewing Your Website?
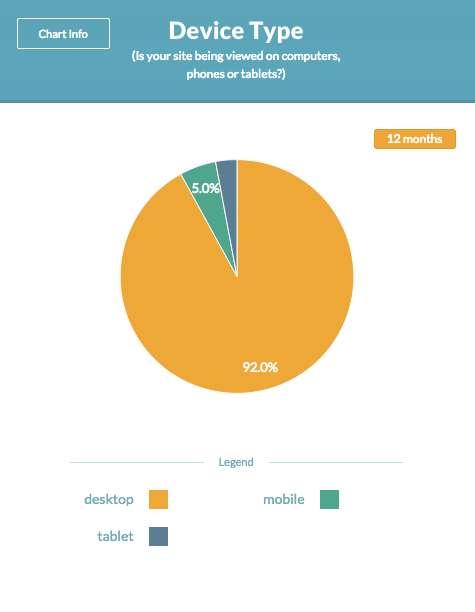
This chart segments your visitors into three categories.
- Mobile is the percentage of people viewing your website on a smartphone
-
Tablet is the percentage of people viewing your website on a tablet or e-Reader
-
Desktop is the percentage of people viewing your website on desktops and laptops
4. Visit Length - How Long Do Visitors Stay On Your Site?

This chart can track the last year, six months, 30 days, or week increments.
5. Bounce Rate - How Many People Came To Your Site And Immediately Left?

This chart shows the percentage of visitors who come to your website and don’t click on or engage with your content before leaving. Generally bounce rates are between 30-65% but if they are consistently high, it could mean an issue with the website or the content.
This is just a snapshot of the Dashboard. If you’re interested in learning more about responsive websites, church website analytics, or our e360 themes, contact us here.
Insight From Churches Already Using the Dashboard
"I love how visual and easy it is to use. The one thing that stood out for me is being able to see what day of the week people are coming to our site. We get a ton of traffic on Saturday so we’re going to start posting content on that day." Cody Vermillion, Communication Director - Rancho Bernardo Community Presbyterian Church
"I like the simplified presentation of the data in the dashboard on Ekklesia 360. We have been using Google Analytics for our website metrics for years now, and the amount of information available is awesome but unless you make a custom dashboard, the desired data can be a bit elusive." Warren King, Technology Coordinator - Port City Community Church
Check back on our blog in April for tips, tricks, and more success stories as churches begin to utilize the Dashboard features. In the meantime, check out a podcast our strategist did with Church Marketing Sucks. In this podcast, AJ discusses why your church should be tracking analytics, how to do it, and why the information gathered from analytics is important to church leadership. Click here to listen.

Also, if you're looking for more information about using analytics for your church website, we've created an analytics eBook, "How To Improve Your Church Website Using Quarterly Web Analytics Reviews." Click below to download it.


